Bored, nothing to do, and checking out your performance metrics? First off, use VMware vRealize Operations (vROps, formerly vCOps), and take up a new hobby in all your spare time; thank me later. Still need to take a look because you’re troubleshooting a slow VM? Concerned about if you’re oversubscribing your CPUs? High kernel times?
A basic explanation of CPU Ready Time is: how long is your virtual machine is waiting in line to use the CPU on the host? There is a very acceptable percentage (in general, under 10%, more on that below), however oversubscribing will definitely cause you (or clients) headaches. An example of when you have this problem is a generally slow VM, but task manager/TOP isn’t showing something eating up all your CPU, and all other metrics look fine. Extreme cases will make the VM’s clock slow. Perhaps high kernel time? Josh at vmtoday has an image of this example on his very relevant post.
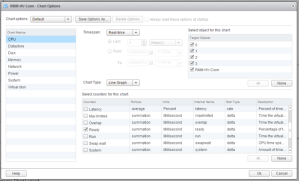
When you look at these graphs and see high numbers, don’t necessarily worry. There’s a pretty easy formula to figure out what you’re looking at. In the example I’m using below, I’m using the performance chart for the VM, realtime, which has a metric rollup time of 20 seconds. Here’s how I got it to that, and what it looks like:


If you’re looking at graphs of different timeframes, you want to use a separate number in the formula:
- Realtime: 20 seconds – We’re using this one in my example
- Past Day: 5 minutes (300 seconds)
- Past Week: 30 minutes (1800 seconds)
- Past Month: 2 hours (7200 seconds)
- Past Year: 1 day (86400 seconds)
(CPU summation value / (<Chart Interval in Seconds> * 1000)) * 100 = % CPU ready
It’s probably hard to see, but I’m interested in the VM average of 547 at a realtime (20 second) interval. I toss those numbers into the formula:
(547 / (20 seconds * 1000)) * 100 = 2.73% CPU Ready
With only 2.73% CPU ready time, I can see this VM isn’t having any CPU problems.
Some different resources concur that up to 10% is acceptable, but something over 10% should require some reviewing. Keep in mind the time-frame you’re looking at this: realtime during high production times may not be the most accurate for an overview. If that’s the case, check out a daily or weekly average instead.
Additional resources on this topic including all about using CPU affinity:
- Performance Best Practices for VMware vSphere 5.5 (PDF)
- VMware KB 2002181: Converting Between CPU Summation and CPU Ready Time
- VMware KB 2001003: Troubleshooting ESXi Virtual Machine Performance Issues
- VMware Whitepaper: CPU Scheduler in vSphere 5.1(PDF)
- Beating a dead horse – using CPU affinity – Frank Denneman


4 replies on “vSphere CPU ready time”
Hello, I’m a SQL Server DBA trying to performance tune on a virtual machine. I have read-only access to my companies vSphere Web Client (version 5.5.0) but cannot locate the CPU ready time. Sorry for such a noob question but can you explain how to navigate to this display? Alternatively, Do I need to perform a desktop client installation of the VMware administration tool to see this?
Any help appreciated.
Ken
LikeLike
Would the correct calculation not be as follows?
((CPU summation value / ( * 1000)) * 100 = % CPU ready)/Number of vCpus
I thought the recommendation was not over 10% per cpu?
LikeLike
Hey Dave,
I had used this as a reference (KB 2002181) which shows you how ESXTOP converts between the metrics for the VM (as a whole) regarding CPU ready time, rather than per-core. Because VMware uses a Gang-CPU scheduler for VMs, it doesn’t matter whether one core or more cores need to wait – they all need to be available at the same time for the VM. For example, if one core constantly needs to wait, the overall VM will suffer. Does this help clear things up?
LikeLike
Agree, vSphere adds all vCPU together.
So if a VM is waiting 10ms all 4 vCPU wait for 10ms total dispalyed is 40ms.
So when you calculate CPU Ready you have to devide bij nr of vCPU’s
LikeLike